OpenTelemetry in .NET
Professional Trace, Metric, and Log implementation in ASP.NET Core — from code to the Collector and Production
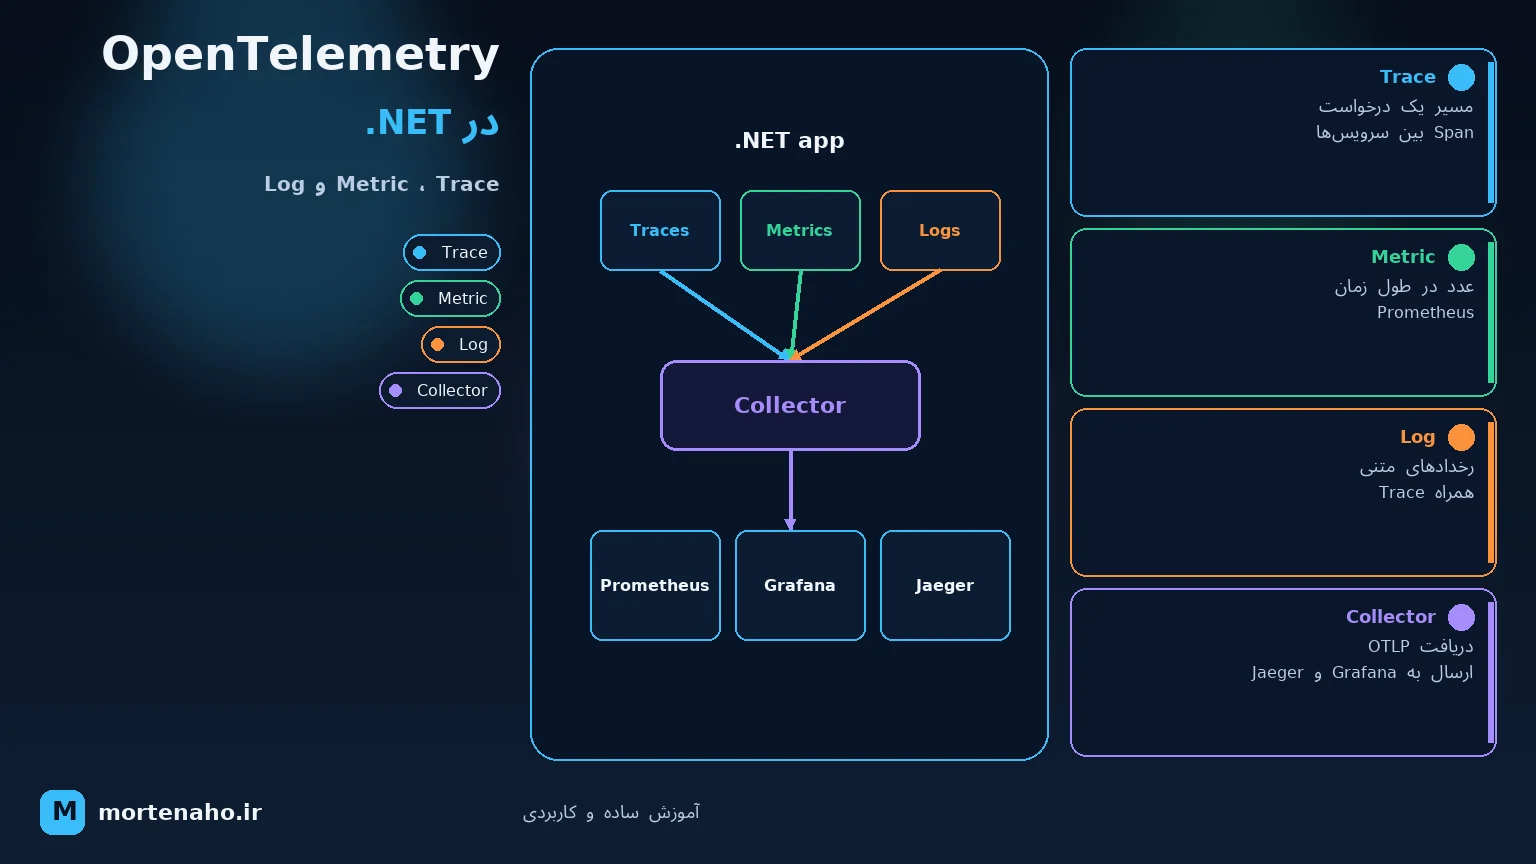
What we'll build in this tutorial
We instrument an ASP.NET Core API automatically and manually, follow HTTP requests across services, create business metrics, correlate logs with TraceId, and send all telemetry to the OpenTelemetry Collector via OTLP.
Then we cover Sampling, Cardinality, security, queue and retry, testing, troubleshooting, and a Production-ready architecture. The goal is not just "seeing a few spans" — it is building a reliable Observability system.
1. What is Observability?
Monitoring answers predefined questions: "What is CPU usage?" or "How many requests failed?" Observability helps you find unknown problems by examining system outputs: "Why has payment become slow for only some users?"
The three main Observability signals:
| Signal | What question does it answer? | Example |
|---|---|---|
| Trace | Where did this request go, and where did it slow down or fail? | API → Order Service → Payment Service → Database |
| Metric | What is the overall system state over time? | Error rate, p95 latency, order count |
| Log | What happened at a specific moment? | Payment rejected for order 42 |
2. What is OpenTelemetry?
OpenTelemetry (OTel) is an open standard and toolkit for producing, processing, and exporting telemetry. OTel is not the final place to view data; it sends data in a standard shape to backends like Grafana, Jaeger, Prometheus, Azure Monitor, Datadog, or Elastic.
What does OTel provide?
- Standard API and SDK for Trace, Metric, and Log
- Ready-made instrumentation for ASP.NET Core, HttpClient, gRPC, SQL, and other libraries
- Semantic Conventions for consistent attribute naming
- OTLP protocol for telemetry transport
- Standalone Collector for receiving, processing, and exporting data
- Standard context propagation across services with W3C Trace Context
3. OpenTelemetry architecture
Important SDK components
| Component | Role |
|---|---|
| Resource | Identity of the data producer; e.g. service name, version, instance, and environment |
| Instrumentation | Automatic or manual telemetry creation |
| Provider | Manages the pipeline for each signal |
| Processor | Processes data before export; e.g. batch |
| Exporter | Sends data to Console, OTLP, or another destination |
| Propagator | Transfers Trace Context across processes |
4. Trace, Span, Metric, and Log
Trace and Span
A trace is the full journey of a request. Each step is a Span. In .NET, Activity represents a Span and ActivitySource creates it.
Trace: POST /checkout
├── Span: ASP.NET Core request
├── Span: Validate cart
├── Span: POST payment-service
│   └── Span: SQL UPDATE Payments
└── Span: Publish OrderPaid
Each Span typically includes:
TraceId: shared identifier for the entire journeySpanId: identifier for that step- Parent Span, start time, and duration
- Status, Events, and Attributes
- Resource of the producing service
Metric
A metric is aggregated numeric data. Main instrument types in .NET:
- Counter: only increases; e.g. successful order count.
- Histogram: records value distribution; e.g. checkout duration.
- UpDownCounter: goes up and down; e.g. active job count.
- Observable Gauge: reads the current value at collection time; e.g. queue size.
Log
OTel does not replace ILogger. You use standard .NET logging, and the OpenTelemetry Provider exports structured LogRecords with TraceId and SpanId.
5. ASP.NET Core project setup
Create a Web API:
dotnet new webapi -n Shop.Api
cd Shop.Api
Install required packages without pinning versions so NuGet picks a version compatible with your project:
dotnet add package OpenTelemetry.Extensions.Hosting
dotnet add package OpenTelemetry.Exporter.OpenTelemetryProtocol
dotnet add package OpenTelemetry.Instrumentation.AspNetCore
dotnet add package OpenTelemetry.Instrumentation.Http
dotnet add package OpenTelemetry.Instrumentation.RuntimeComplete Program.cs configuration
using System.Reflection;
using OpenTelemetry.Logs;
using OpenTelemetry.Metrics;
using OpenTelemetry.Resources;
using OpenTelemetry.Trace;

var builder = WebApplication.CreateBuilder(args);

const string serviceName = "shop-api";
var serviceVersion =
    Assembly.GetExecutingAssembly().GetName().Version?.ToString()
    ?? "unknown";

builder.Services
    .AddOpenTelemetry()
    .ConfigureResource(resource => resource
        .AddService(
            serviceName: serviceName,
            serviceVersion: serviceVersion,
            serviceInstanceId: Environment.MachineName)
        .AddAttributes(new Dictionary<string, object>
        {
            ["deployment.environment.name"] =
                builder.Environment.EnvironmentName
        }))
    .WithTracing(tracing => tracing
        .AddSource(ShopTelemetry.ActivitySourceName)
        .AddAspNetCoreInstrumentation(options =>
        {
            options.RecordException = true;
            options.Filter = context =>
                !context.Request.Path.StartsWithSegments("/health");
        })
        .AddHttpClientInstrumentation(options =>
        {
            options.RecordException = true;
        })
        .AddOtlpExporter())
    .WithMetrics(metrics => metrics
        .AddMeter(ShopTelemetry.MeterName)
        .SetExemplarFilter(ExemplarFilterType.TraceBased)
        .AddAspNetCoreInstrumentation()
        .AddHttpClientInstrumentation()
        .AddRuntimeInstrumentation()
        .AddOtlpExporter());

builder.Logging.AddOpenTelemetry(options =>
{
    options.IncludeFormattedMessage = true;
    options.IncludeScopes = true;
    options.SetResourceBuilder(
        ResourceBuilder.CreateDefault()
            .AddService(
                serviceName,
                serviceVersion: serviceVersion,
                serviceInstanceId: Environment.MachineName)
            .AddAttributes(new Dictionary<string, object>
            {
                ["deployment.environment.name"] =
                    builder.Environment.EnvironmentName
            }));
    options.AddOtlpExporter();
});

builder.Services.AddHttpClient();
builder.Services.AddHealthChecks();

var app = builder.Build();

app.MapHealthChecks("/health");
app.MapGet("/", () => "Shop API is running");

app.Run();
OTLP configuration with environment variables
OTEL_EXPORTER_OTLP_ENDPOINT=http://localhost:4317
OTEL_EXPORTER_OTLP_PROTOCOL=grpc
The default OTLP exporter in .NET uses gRPC and address http://localhost:4317. For HTTP/Protobuf, port is usually 4318, and signal endpoints use paths /v1/traces, /v1/metrics, and /v1/logs.
6. Automatic library instrumentation
The code above produces a lot of data without changing controllers:
| Instrumentation | Data produced |
|---|---|
| ASP.NET Core | Incoming request, route, method, status code, and duration |
| HttpClient | Outgoing request and automatic Trace Context propagation |
| Runtime | GC, heap, thread pool, allocation, and runtime metrics |
For SQL Client, gRPC, Redis, and other libraries, review and install compatible instrumentation separately. Do not enable every package just because it exists; evaluate cost, stability, and what data it collects.
Why did we filter the health endpoint?
Kubernetes or a load balancer may hit health checks every few seconds. Tracing all of them creates high volume and cost and hides important traces in noise. Health metrics and error logs can still be managed separately.
7. Professional manual tracing with ActivitySource
Automatic instrumentation sees technical boundaries, but it does not know what "reserve inventory" or "calculate discount" means. Create manual Spans for important business operations.
Central Telemetry class
using System.Diagnostics;
using System.Diagnostics.Metrics;

public static class ShopTelemetry
{
    public const string ActivitySourceName = "Shop.Api";
    public const string MeterName = "Shop.Api";

    public static readonly ActivitySource ActivitySource =
        new(ActivitySourceName);

    public static readonly Meter Meter =
        new(MeterName);

    public static readonly Counter<long> OrdersCompleted =
        Meter.CreateCounter<long>(
            "shop.orders.completed",
            unit: "{order}",
            description: "Number of completed orders");

    public static readonly Histogram<double> CheckoutDuration =
        Meter.CreateHistogram<double>(
            "shop.checkout.duration",
            unit: "s",
            description: "Checkout duration in seconds");
}ActivitySource and Meter once with a long lifetime; do not create them per request. Their names must also be registered in AddSource and AddMeter.
Creating a Span for checkout
using System.Diagnostics;

public sealed class CheckoutService(ILogger<CheckoutService> logger)
{
    public async Task CompleteAsync(
        Guid orderId,
        string paymentProvider,
        CancellationToken cancellationToken)
    {
        var startedAt = Stopwatch.GetTimestamp();

        using var activity = ShopTelemetry.ActivitySource.StartActivity(
            "Checkout order",
            ActivityKind.Internal);

        activity?.SetTag("shop.order.id", orderId.ToString());
        activity?.SetTag("payment.provider", paymentProvider);

        try
        {
            logger.LogInformation(
                "Checkout started for order {OrderId}",
                orderId);

            await ReserveInventoryAsync(orderId, cancellationToken);
            await ChargeAsync(orderId, cancellationToken);

            ShopTelemetry.OrdersCompleted.Add(
                1,
                new KeyValuePair<string, object?>(
                    "payment.provider",
                    paymentProvider));

            activity?.SetStatus(ActivityStatusCode.Ok);
        }
        catch (Exception exception)
        {
            activity?.AddException(exception);
            activity?.SetStatus(
                ActivityStatusCode.Error,
                "Checkout failed");

            logger.LogError(
                exception,
                "Checkout failed for order {OrderId}",
                orderId);

            throw;
        }
        finally
        {
            ShopTelemetry.CheckoutDuration.Record(
                Stopwatch.GetElapsedTime(startedAt).TotalSeconds,
                new KeyValuePair<string, object?>(
                    "payment.provider",
                    paymentProvider));
        }
    }

    private static Task ReserveInventoryAsync(
        Guid orderId,
        CancellationToken cancellationToken) => Task.CompletedTask;

    private static Task ChargeAsync(
        Guid orderId,
        CancellationToken cancellationToken) => Task.CompletedTask;
}
Span design rules
- Create Spans for meaningful operations, not every small method.
- Keep Span names stable and low-cardinality;
Checkout orderis better thanCheckout order 42. - Put variable identifiers in Attributes, not in the Span name.
- Record real errors with Status Error and an Exception Event.
- Very short, high-volume internal Spans only add cost and noise.
Tag, Event, and Baggage
| Concept | Use |
|---|---|
| Tag / Attribute | Searchable property of the Span; e.g. payment.provider |
| Event | Timed occurrence inside a Span; e.g. inventory.reserved |
| Baggage | Data carried with context to the next service |
8. Custom metrics and Cardinality
Technical metrics like HTTP latency are not enough. Business metrics help you understand the impact of technical problems: how many checkouts failed? Which payment method is slower?
Example Counter and Histogram recording from the previous section:
ShopTelemetry.OrdersCompleted.Add(
    1,
    new KeyValuePair<string, object?>(
        "payment.provider",
        "bank-a"));

ShopTelemetry.CheckoutDuration.Record(
    0.425,
    new KeyValuePair<string, object?>(
        "payment.provider",
        "bank-a"));
What is Cardinality?
Each unique label combination creates a new time series. If you label metrics with order.id or user.id, millions of series are produced and memory, cost, and query speed suffer.
| Good metric label | Dangerous label |
|---|---|
payment.provider=bank-a | order.id=9f... |
result=success|failed | user.email=... |
region=tehran | request.url with query string |
http.route=/orders/{id} | url.path=/orders/12345 |
Exemplar: bridge from Metric to Trace
With ExemplarFilterType.TraceBased, some metric samples can carry the TraceId of a sample request. If the backend supports it, you can jump from an unusual point on a latency chart directly into the trace for that request.
What should we measure?
- Rate: requests or operations per second
- Errors: failure rate and type
- Duration: time distribution and p50, p95, p99 percentiles
- Saturation: queue, thread pool, connection pool, and limited resources
- Business: orders, payments, and important domain events
9. Structured logs and Trace correlation
Use structured templates, not string interpolation:
// Correct: OrderId is a searchable property
logger.LogInformation(
    "Order {OrderId} paid using {Provider}",
    orderId,
    provider);

// Weaker: only a final string is produced
logger.LogInformation(
    $"Order {orderId} paid using {provider}");
When a log is created inside an active Activity, OpenTelemetry automatically correlates TraceId and SpanId with the LogRecord. In the backend, you can go from a trace to the logs for the same request.
Scope for shared context
using (logger.BeginScope(new Dictionary<string, object>
{
    ["OrderId"] = orderId,
    ["TenantId"] = tenantId
}))
{
    logger.LogInformation("Payment started");
    await ProcessPaymentAsync();
    logger.LogInformation("Payment finished");
}
With IncludeScopes = true, these properties are added to logs inside the scope.
10. Why the OpenTelemetry Collector matters
The application can export directly to a backend, but in Production sending to a Collector is usually better:
- Switch backends without redeploying the application
- Batch, retry, queue, and memory control
- Remove or transform sensitive attributes
- Route one input to multiple backends
- Tail Sampling based on the complete Trace outcome
- Fewer connections and centralized credential management
Local Collector configuration
File otel-collector-config.yaml:
receivers:
  otlp:
    protocols:
      grpc:
        endpoint: 0.0.0.0:4317
      http:
        endpoint: 0.0.0.0:4318

processors:
  memory_limiter:
    check_interval: 1s
    limit_mib: 400
    spike_limit_mib: 100
  batch:
    timeout: 5s
    send_batch_size: 1024

exporters:
  debug:
    verbosity: normal

extensions:
  health_check:
    endpoint: 0.0.0.0:13133

service:
  extensions: [health_check]
  pipelines:
    traces:
      receivers: [otlp]
      processors: [memory_limiter, batch]
      exporters: [debug]
    metrics:
      receivers: [otlp]
      processors: [memory_limiter, batch]
      exporters: [debug]
    logs:
      receivers: [otlp]
      processors: [memory_limiter, batch]
exporters: [debug]debug exporter is for learning and troubleshooting, not Production. In a real environment, replace it with an OTLP exporter to your destination.
More resilient exporter for a remote backend
To prevent the queue from being lost on Collector restart, use file_storage and a persistent volume. Then place the exporter in each pipeline:
The receivers and processors sections from the previous full configuration remain unchanged.
extensions:
  health_check:
    endpoint: 0.0.0.0:13133
  file_storage:
    directory: /var/lib/otelcol/storage

exporters:
  otlp_grpc/backend:
    endpoint: ${env:OBSERVABILITY_OTLP_ENDPOINT}
    headers:
      authorization: "Bearer ${env:OBSERVABILITY_TOKEN}"
    tls:
      insecure: false
    sending_queue:
      enabled: true
      storage: file_storage
      queue_size: 5000
    retry_on_failure:
      enabled: true
      initial_interval: 5s
      max_interval: 30s
      max_elapsed_time: 10m

service:
  extensions: [health_check, file_storage]
  pipelines:
    traces:
      receivers: [otlp]
      processors: [memory_limiter, batch]
      exporters: [otlp_grpc/backend]
    metrics:
      receivers: [otlp]
      processors: [memory_limiter, batch]
      exporters: [otlp_grpc/backend]
    logs:
      receivers: [otlp]
      processors: [memory_limiter, batch]
exporters: [otlp_grpc/backend]otlp_grpc. The old name otlp is currently a deprecated alias and produces a warning.
An infinite queue is not a solution. Calculate queue size, disk space, and acceptable outage duration based on actual telemetry rate and monitor the Collector's own metrics. A persistent queue and retry reduce the chance of loss, but do not guarantee exactly-once delivery — data may still be dropped after the queue fills or retry time expires.
11. Running the Collector with Docker
Sample docker-compose.yml:
services:
  shop-api:
    build:
      context: .
      dockerfile: Shop.Api/Dockerfile
    environment:
      ASPNETCORE_ENVIRONMENT: Production
      OTEL_EXPORTER_OTLP_ENDPOINT: http://otel-collector:4317
      OTEL_EXPORTER_OTLP_PROTOCOL: grpc
    ports:
      - "8080:8080"
    depends_on:
      - otel-collector

  otel-collector:
    image: otel/opentelemetry-collector-contrib:0.156.0
    command: ["--config=/etc/otelcol-contrib/config.yaml"]
    volumes:
      - ./otel-collector-config.yaml:/etc/otelcol-contrib/config.yaml:ro
      - otel-storage:/var/lib/otelcol/storage
    ports:
      - "127.0.0.1:13133:13133"

volumes:
  otel-storage:
Inside Compose, localhost in the application container points to that same container. So the endpoint must be the service name otel-collector. Because the application and Collector are on the internal Compose network, we did not expose OTLP ports on the host.
127.0.0.1:4317:4317. Mapping 4317:4317 on all interfaces exposes an endpoint without TLS and authentication to the network.
Version 0.156.0 is the pinned, verified version at the time this tutorial was written. Before upgrading, review release notes, component stability, and configuration schema changes.
Local backend
For development you can connect the Collector to Jaeger, Grafana Tempo, Prometheus, and Loki, or use a ready-made local stack. In Production, backend choice depends on volume, retention, query needs, cost, and security requirements.
Prometheus and Grafana for metrics
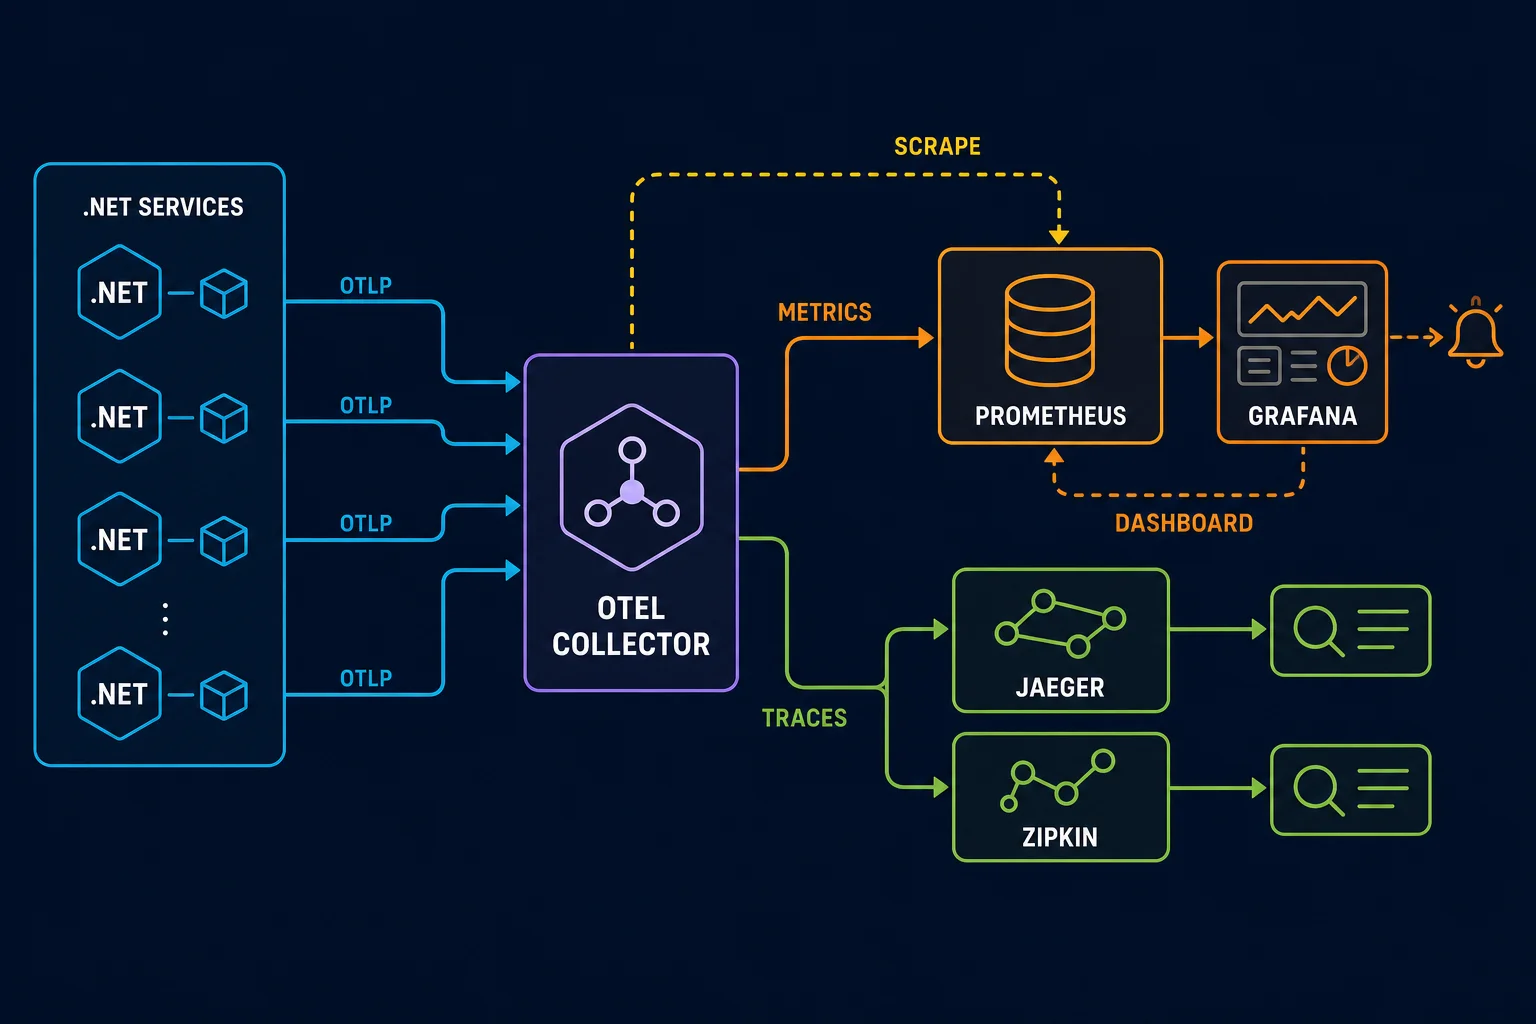
What role does each tool play?
| Tool | Role | How does it get data? |
|---|---|---|
| OpenTelemetry SDK | Produces metrics inside the application | .NET instrumentation |
| Collector | Receives, processes, and converts metrics | Application pushes data via OTLP |
| Prometheus | Stores time series and runs PromQL | Scrapes the Collector endpoint |
| Grafana | Dashboards, Explore, and alerts | Queries Prometheus; in this architecture it is not the primary metric store |
1. Enable Prometheus exporter in the Collector
Combine these sections with the previous Collector configuration:
exporters:
  prometheus:
    endpoint: 0.0.0.0:8889

service:
  pipelines:
    metrics:
      receivers: [otlp]
      processors: [memory_limiter, batch]
      exporters: [prometheus]
The Collector creates a Prometheus-format endpoint on internal port 8889. You do not need to publish this port on the host or internet; Prometheus on the same Docker network can reach it.
2. Configure Prometheus for scraping
File prometheus.yml:
global:
  scrape_interval: 15s
  evaluation_interval: 15s

scrape_configs:
  - job_name: "otel-collector"
    static_configs:
      - targets: ["otel-collector:8889"]
3. Add Prometheus and Grafana to Docker Compose
Add the following services to the previous Compose file:
services:
  prometheus:
    image: prom/prometheus:v3.13.1
    command:
      - --config.file=/etc/prometheus/prometheus.yml
      - --storage.tsdb.path=/prometheus
    volumes:
      - ./prometheus.yml:/etc/prometheus/prometheus.yml:ro
      - prometheus-data:/prometheus
    ports:
      - "127.0.0.1:9090:9090"
    depends_on:
      - otel-collector

  grafana:
    image: grafana/grafana:13.1.0
    environment:
      GF_SECURITY_ADMIN_USER: admin
      GF_SECURITY_ADMIN_PASSWORD: ${GRAFANA_ADMIN_PASSWORD:?set it}
    volumes:
      - grafana-data:/var/lib/grafana
    ports:
      - "127.0.0.1:3000:3000"
    depends_on:
      - prometheus

volumes:
  prometheus-data:
grafana-data:.env file outside Git or in a Secret Manager.
4. Connect Grafana to Prometheus
- Open Grafana at
http://localhost:3000. - Go to Connections → Data sources.
- Select Prometheus.
- Set URL to
http://prometheus:9090, not localhost; Grafana runs inside a container. - Click Save & test and run a query in Explore.
Useful PromQL queries
# Total request rate over the last five minutes
sum(rate(http_server_request_duration_seconds_count[5m]))

# 95th percentile response time
histogram_quantile(
  0.95,
  sum by (le) (
    rate(http_server_request_duration_seconds_bucket[5m])
  )
)

# Completed orders per minute
sum(rate(shop_orders_completed_total[1m]))What dashboards should we build?
- Request rate, error rate, and p50/p95/p99 latency
- .NET CPU, GC, heap, allocation, and thread pool
- Checkout count, payment failure rate, and business operation duration
- Collector queue status and failed exports
- Alerts for error rate, latency, and missing telemetry
Jaeger or Zipkin for distributed tracing
Jaeger and Zipkin are trace backends and search UIs. They place spans related to a TraceId together so you can see the request path across services, timing of each step, and where errors occurred.

Jaeger: recommended choice for a new example
Jaeger 2.x accepts OTLP directly. The Collector can send traces to Jaeger with standard OTLP; no legacy Jaeger exporter is needed:
exporters:
  otlp_grpc/jaeger:
    endpoint: jaeger:4317
    tls:
      insecure: true

service:
  pipelines:
    traces:
      receivers: [otlp]
      processors: [memory_limiter, batch]
      exporters: [otlp_grpc/jaeger]
Add the Jaeger service to Compose:
services:
  jaeger:
    image: cr.jaegertracing.io/jaegertracing/jaeger:2.19.0
    ports:
      - "127.0.0.1:16686:16686"
Internal port 4317 is reachable by the Collector via the Compose network and does not need to be published on the host. The Jaeger UI opens at http://localhost:16686.
Seeing your first trace in Jaeger
- Send a few requests to the API; ideally one includes an HttpClient call to another service.
- In Jaeger UI, select service
shop-api. - Click Find Traces.
- Open a trace and inspect Waterfall, duration, status, tags, and exception events.
- Compare TraceId with the TraceId in the log for the same request.
Zipkin as an alternative
If you already have Zipkin, the Collector can convert and send traces to its v2 API:
exporters:
  zipkin:
    endpoint: http://zipkin:9411/api/v2/spans
    format: proto

service:
  pipelines:
    traces:
      receivers: [otlp]
      processors: [memory_limiter, batch]
      exporters: [zipkin]
Zipkin service:
services:
  zipkin:
    image: openzipkin/zipkin:3.6.1
    ports:
      - "127.0.0.1:9411:9411"
The Zipkin UI is available at http://localhost:9411.
| Jaeger | Zipkin |
|---|---|
| Direct OTLP support in newer versions | Collector converts OTel data to Zipkin v2 |
| Strong UI for trace search and analysis | Simple setup, suitable for existing Zipkin infrastructure |
| Natural choice for new OpenTelemetry projects | Suitable for legacy compatibility or specific needs |
If traces are incomplete
- Ensure all services propagate the standard
traceparentheader. - Use managed
HttpClientfor HTTP requests so propagation happens automatically. - For message brokers, inject context in message headers and extract it in the consumer.
- Sampling must preserve the parent decision correctly across all services.
- Set service name, version, and environment in Resource.
- Node clocks must be synchronized so the Waterfall is not misleading.
12. Sampling: controlling trace volume
Storing 100% of traces in high-traffic systems is expensive. Sampling decides which traces are recorded.
Head Sampling in the SDK
.WithTracing(tracing => tracing
    .SetSampler(
        new ParentBasedSampler(
            new TraceIdRatioBasedSampler(0.10)))
    .AddAspNetCoreInstrumentation()
    .AddHttpClientInstrumentation()
    .AddOtlpExporter())
This example selects about 10% of root traces and preserves the parent decision in downstream services. It is fast and cheap, but at request start it does not yet know whether an error will occur at the end.
ParentBasedSampler accepts the incoming parent decision. On a public API, an anonymous client can send a traceparent header with the sampled flag and bypass the 10% rate. At an untrusted boundary — such as an API Gateway — drop or reset untrusted incoming context, or explicitly configure remote parent behavior according to your security policy.
Tail Sampling in the Collector
Tail Sampling decides after seeing the spans of a trace; e.g. keep all errors, requests over two seconds, and a percentage of the rest.
AlwaysOnSampler upstream in the SDK and leave the main decision to Tail Sampling. Combining 10% Head Sampling with Tail Sampling means the Collector only chooses among that 10%.
// When the main Sampling decision happens in the Collector
.SetSampler(new AlwaysOnSampler())
In the same Collector file, define the processor and add it to the trace pipeline:
processors:
  tail_sampling:
    decision_wait: 10s
    num_traces: 50000
    policies:
      - name: keep-errors
        type: status_code
        status_code:
          status_codes: [ERROR]
      - name: keep-slow
        type: latency
        latency:
          threshold_ms: 2000
      - name: sample-normal
        type: probabilistic
        probabilistic:
          sampling_percentage: 10

service:
  pipelines:
    traces:
      receivers: [otlp]
      processors: [memory_limiter, tail_sampling, batch]
exporters: [otlp_grpc/backend]decision_wait based on actual trace duration and network delay; a span that arrives after the decision may be split or dropped.
13. Production design
Correct Resource
At minimum, these attributes must be identifiable:
service.name: stable and meaningful; e.g.shop-apiservice.version: build version or commit SHAservice.instance.id: instance or poddeployment.environment.name: production or staging
Do not derive the service name from hostname or a random container name; your dashboards and alerts will fragment across different names.
Propagator and service boundaries
ASP.NET Core and HttpClient instrumentation propagate W3C traceparent by default. If you use a message broker, inject context in message headers and extract it on consume; do not just copy TraceId as plain text.
Security and privacy
- Protect communication between application, Collector, and backend with TLS.
- Do not expose OTLP ports on the public internet without reason.
- Keep API tokens in a Secret Manager.
- Do not blindly capture Authorization, Cookie, query string, body, and SQL parameters.
- Remove or mask PII and secrets before export.
- Treat telemetry retention and access like Production data.
Cost and performance
- Use a Batch Processor; exporting on every request synchronously is wrong.
- Remove high-volume, low-value Spans and logs.
- Tune sampling based on traffic and budget.
- Limit metric cardinality and review expensive dashboards.
- Monitor the Collector itself: queue size, failed exports, refused data, CPU, and memory.
Agent, Gateway, or Sidecar?
| Model | Advantage | Cost |
|---|---|---|
| Central Gateway | Simple management, centralized routing and credentials | Requires scale and high availability |
| Agent on each node | Local connection and host telemetry collection | More instances |
| Sidecar next to each app | Isolation and independent configuration | More resource use and operations |
| Agent → Gateway | Combines local connection and central processing | More complex architecture but suitable at scale |
Observability in CI/CD
Fill service.version from commit SHA or release version and create deployment events. After deploy, compare error rate and latency of the new version with the previous one. For designing this path, see the CI/CD tutorial.
14. Testing and troubleshooting
Start with the Console Exporter
For quick local inspection, add this package:
dotnet add package OpenTelemetry.Exporter.ConsoleAnd temporarily on the desired pipeline:
.AddConsoleExporter()If you see no data
- Is the
ActivitySourcename registered exactly inAddSource? - Is the
Metername registered inAddMeter? - Is the endpoint correct inside Docker and using the service name?
- Are protocol and port aligned: gRPC on 4317 or HTTP on 4318?
- Is the receiver only defined or actually active in a Collector pipeline?
- Has sampling dropped the data?
- Does the Collector receive data but the exporter reject it? Temporarily enable the debug exporter.
- Are system clocks synchronized? Time skew makes trace display confusing.
Testing custom instrumentation
For unit tests you can use the In-Memory Exporter and verify the desired Span or Metric was created with the correct attributes. Tests should not connect to a real backend.
dotnet add package OpenTelemetry.Exporter.InMemoryIn integration tests, send a real request to the API and verify propagation, span names, status, and removal of sensitive information.
15. Final checklist
- Service name, version, instance, and environment are defined.
- ASP.NET Core, HttpClient, and Runtime instrumentation are enabled.
- We have custom Spans and Metrics for important business operations.
- Logs are structured and correlated with TraceId.
- We have no high-cardinality metric labels.
- PII, secrets, and sensitive headers are not exported.
- The application sends to the Collector via OTLP, not directly to multiple backends.
- The Collector has memory limiter, batch, queue, retry, and health check.
- Sampling is designed based on volume, errors, and latency.
- The telemetry pipeline itself is monitored and alerted.
- Collector and package versions are pinned and upgrades are tested.
- Troubleshooting runbook and retention budget are defined.
OpenTelemetry is valuable when it produces little but meaningful, reliable, correlated, and actionable data — collecting everything alone is not Observability.